Decision Making And Visualizations Based On Test Results
This paper is published with Open Access, so you can download it from ACM here: [1], or from: [2]
Informal Summary
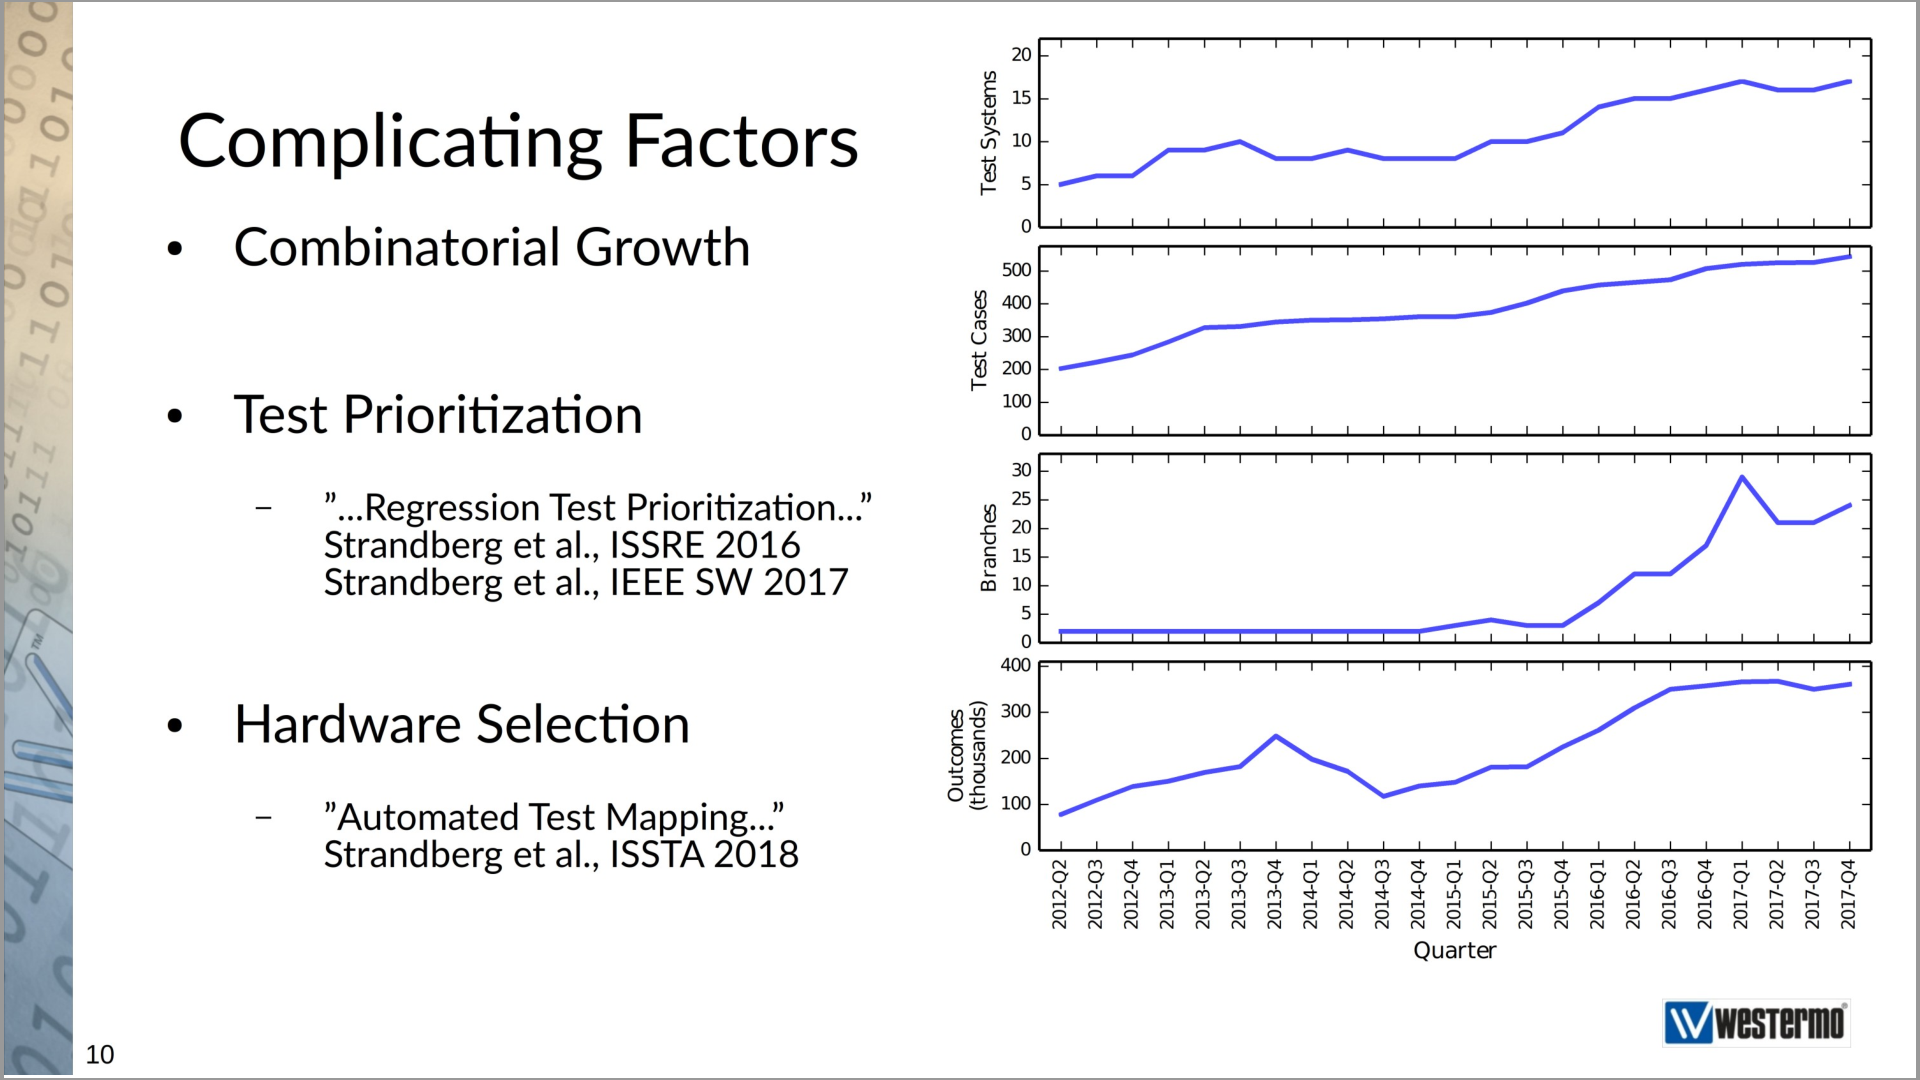
We do test automation of embedded systems in an agile software development process where each feature is developed in separate branches. But there is an increase in number of test systems in use, in the number of test cases in use, and in the number of code branches in use.
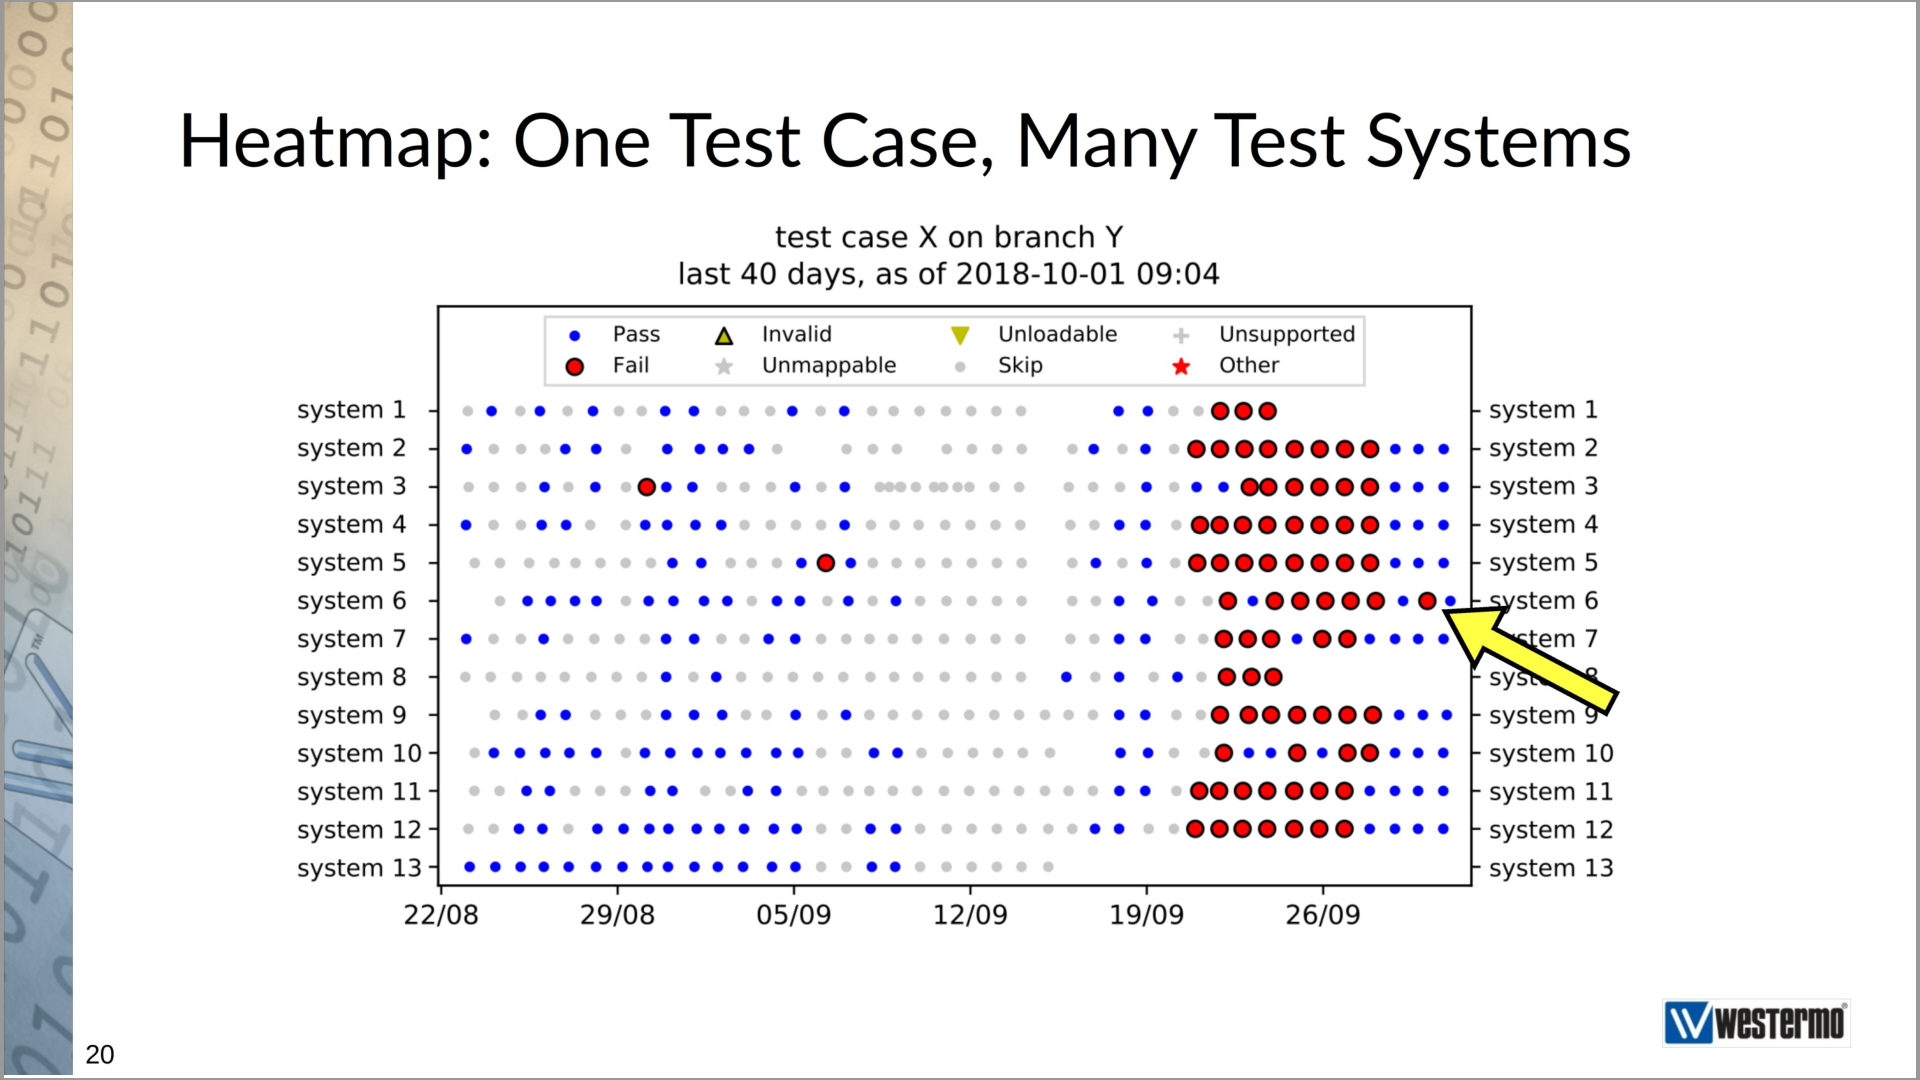
In this paper we explore how we make decisions in three phases of the software development process: daily work, when merging code branches and at release time. One of the visualizations I find most interesting is the "heatmap" that shows results for one test case, in one code branch, over time, and over test system:
Abstract
Background: Testing is one of the main methods for quality assurance in the development of embedded software, as well as in software engineering in general. Consequently, test results (and how they are reported and visualized) may substantially influence business decisions in software-intensive organizations.
Aims: This case study examines the role of test results from automated nightly software testing and the visualizations for decision making they enable at an embedded systems company in Sweden. In particular, we want to identify the use of the visualizations for supporting decisions from three aspects: in daily work, at feature branch merge, and at release time.
Method: We conducted an embedded case study with multiple units of analysis by conducting interviews, questionnaires, using archival data and participant observations.
Results: Several visualizations and reports built on top of the test results database are utilized in supporting daily work, merging a feature branch to the master and at release time. Some important visualizations are: lists of failing test cases, easy access to log files, and heatmap trend plots. The industrial practitioners perceived the visualizations and reporting as valuable, however they also mentioned several areas of improvement such as better ways of visualizing test coverage in a functional area as well as better navigation between different views.
Conclusions: We conclude that visualizations of test results are a vital decision making tool for a variety of roles and tasks in embedded software development, however the visualizations need to be continuously improved to keep their value for its stakeholders
Cite with bibtex
Official ACM bibtex is:
@inproceedings{Strandberg:2018:DMV:3239235.3268921,
 author = {Strandberg, Per Erik and Afzal, Wasif and Sundmark, Daniel},
 title = {Decision Making and Visualizations Based on Test Results},
 booktitle = {Proceedings of the 12th ACM/IEEE International Symposium on Empirical Software Engineering and Measurement},
 series = {ESEM '18},
 year = {2018},
 isbn = {978-1-4503-5823-1},
 location = {Oulu, Finland},
 pages = {34:1--34:10},
 articleno = {34},
 numpages = {10},
 url = {http://doi.acm.org/10.1145/3239235.3268921},
 doi = {10.1145/3239235.3268921},
 acmid = {3268921},
 publisher = {ACM},
 address = {New York, NY, USA},
 keywords = {decision making, software testing, visualizations},
}
Unofficial style is:
- P. E. Strandberg, W. Afzal, and D, Sundmark. Decision making and visualizations based on test results. In Empirical Software Engineering and Measurement (ESEM'18), ACM. 2018.
Belongs to Kategori Publikationer