Software Test Results Exploration And Visualization With Continuous Integration And Nightly Testing
Informal Summary
When test results are produced from multiple software development branches, from multiple test systems, and not all tests are selected for testing each night (see Experience Report Suite Builder), then it can be hard to make sense of the test results. In this paper, we report on a "web portal" we implemented to make sense of test results in the daily work, when a feature is complete, and at release time.
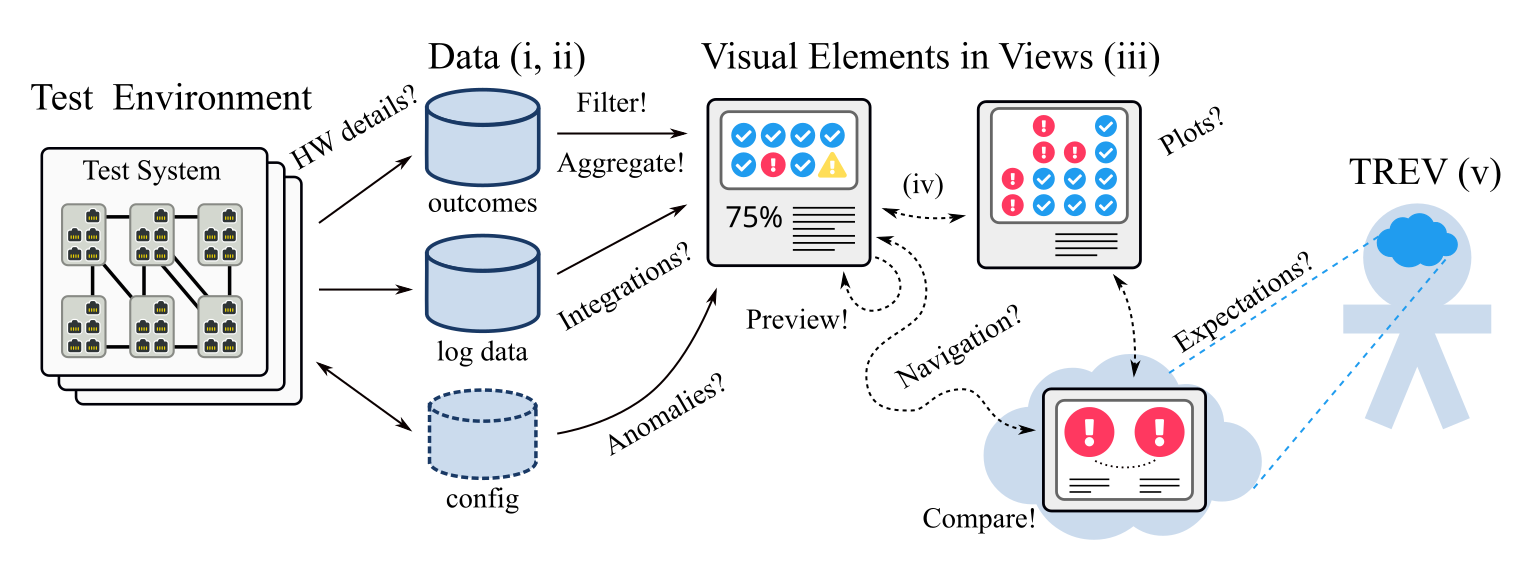
This figure illustrates that the visualization occurs in a human observing visual elements that are generated based on data sources that have measured or collected data in a test environment. Challenges are highlighted with question marks (e.g. distances? anomalies?), and solution patterns with exclamation marks (e.g. filter! compare!).
This paper is Open Access, so you can read the HTML or PDF version at Springer [1], or download the PDF here [2] or here [3] .
Abstract
Software testing is key for quality assurance of embedded systems. However, with increased development pace, the amount of test results data risks growing to a level where exploration and visualization of the results are unmanageable. This paper covers a tool, Tim, implemented at a company developing embedded systems, where software development occurs in parallel branches and nightly testing is partitioned over software branches, test systems and test cases. Tim aims to replace a previous solution with problems of scalability, requirements and technological flora. Tim was implemented with a reference group over several months. For validation, data were collected both from reference group meetings and logs from the usage of the tool. Data were analyzed quantitatively and qualitatively. The main contributions from the study include the implementation of eight views for test results exploration and visualization, the identification of four solutions patterns for these views (filtering, aggregation, previews and comparisons), as well as six challenges frequently discussed at reference group meetings (expectations, anomalies, navigation, integrations, hardware details and plots). Results are put in perspective with related work and future work is proposed, e.g., enhanced anomaly detection and integrations with more systems such as risk management, source code and requirements repositories.
- This paper can be seen as an extension of Decision Making And Visualizations Based On Test Results
- Belongs to Kategori Publikationer